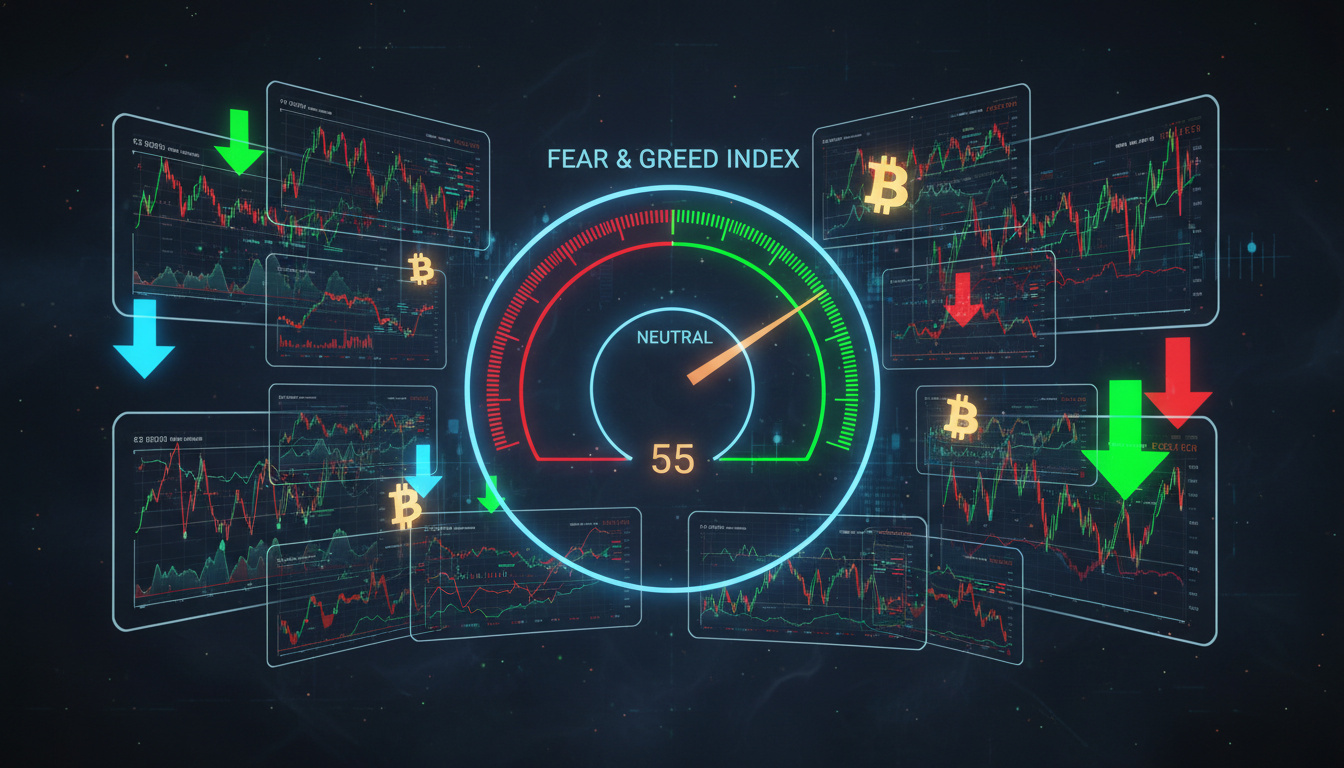
The Fear and Greed Index serves as a quantitative barometer for cryptocurrency market psychology, translating volatile investor emotions into a numerical scale ranging from 0 to 100. This sentiment gauge helps traders identify when extreme panic or excessive optimism may be driving Bitcoin and altcoin prices away from fundamental valuations.
Originally developed by CNN for traditional stock markets, the metric has been adapted specifically for digital assets by data providers including Alternative.me. Unlike fundamental analysis that examines technology or earnings, this index captures the collective mood of market participants through real-time aggregation of volatility, volume, and social signals.
For investors navigating the 24/7 cryptocurrency markets, understanding these sentiment swings provides crucial context. The index offers a quantitative check against emotional decision-making, though it functions best as one component within a broader analytical framework.
What Is the Fear and Greed Index?
|
Current Reading
Varies daily; consult Alternative.me or CoinMarketCap for real-time data
|
Scale Range
0 (Extreme Fear) to 100 (Extreme Greed)
|
Primary Use
Cryptocurrency market sentiment analysis and contrarian signal generation
|
Original Source
CNN Business (stocks); Alternative.me (crypto)
|
- Measures emotional extremes in Bitcoin and broader cryptocurrency markets through aggregated data
- Scores below 25 indicate potential buying opportunities during periods of panic selling
- Readings above 75 suggest overheated markets vulnerable to sharp corrections
- Aggregates volatility, trading volume, social media sentiment, and search trend data
- Updates daily based on rolling market activity and historical averages
- Correlates historically with major Bitcoin price trend reversals
- Functions as a contrarian indicator: extreme fear often precedes price rallies
| Component Factor | Weight | Data Measurement |
|---|---|---|
| Volatility | 25% | Current Bitcoin volatility and max drawdown vs. 30/90-day averages |
| Market Momentum/Volume | 25% | Trading volume and momentum vs. recent historical averages |
| Social Media | 15% | Twitter/X interaction volume and sentiment analysis |
| Bitcoin Dominance | 10% | Market cap share of Bitcoin vs. total cryptocurrency market |
| Google Trends | 10% | Search volume for Bitcoin-related queries and keywords |
| Surveys/Market Premium | 15% | Provider-specific metrics including put/call ratios or stablecoin supply data |
What Is the Current Fear and Greed Index Reading?
Live readings fluctuate continuously based on market conditions, requiring real-time access through specialized data platforms. Unlike static metrics, the index responds immediately to volatility spikes, volume surges, and shifts in social sentiment.
Where to Check Live Readings
Investors can access current values through Alternative.me, which provides historical plots alongside current meter readings. CoinGecko and CoinMarketCap offer similar widgets with additional derivative data. For Bitcoin-specific analysis, Bitbo Charts displays historical trends over customizable periods.
Understanding Daily Fluctuations
Values change as new data rolls into the 30-day and 90-day comparison windows. A sudden drop in price volatility might shift the index toward greed within hours, while sustained high volume during a selloff can drive readings into extreme fear territory. Fear and Greed Index – Crypto Market Sentiment Guide provides additional context for interpreting these movements.
How Is the Fear and Greed Index Calculated?
The index aggregates multiple weighted factors into a single score, though exact algorithms vary between providers. Cointree notes that most platforms combine market data with behavioral indicators to capture both rational and emotional market drivers.
Volatility and Price Action Metrics
Comprising 25% of the typical calculation, volatility measurement compares current Bitcoin price swings against 30-day and 90-day averages. Rising volatility and larger maximum drawdowns signal fear, while compressed volatility suggests complacency or greed.
When Bitcoin’s current volatility significantly exceeds recent historical averages, the index typically shifts toward fear, reflecting investor anxiety over price instability and uncertainty.
Market Momentum and Volume Analysis
Trading volume and momentum indicators contribute another 25%, measuring current activity against baseline averages. High positive volume during price increases indicates greed and FOMO (fear of missing out), while high volume during declines suggests panic selling.
Social Media and Search Trend Data
Social media sentiment analysis examines Twitter interaction rates and hashtag velocity. High engagement typically coincides with greed phases. Google Trends data tracks search volume for terms like “bitcoin price manipulation” (indicating fear) versus “bitcoin prediction” (indicating greed).
Rising Bitcoin market capitalization share relative to altcoins often signals flight-to-safety behavior, pushing the index toward fear as investors retreat from speculative assets into perceived stability.
CoinMarketCap incorporates derivatives data including put/call ratios, while CFGI.io emphasizes volatility polarization across 50+ tokens. Scores may vary between platforms due to different weightings.
How to Interpret Fear and Greed Index Levels?
Reading the index requires understanding the emotional extremes represented by different score ranges. Fear and Greed Index – Crypto Sentiment Guide recommends using these levels as contextual markers rather than standalone trading signals.
Extreme Fear and Potential Opportunities
Readings between 0 and 24 indicate Extreme Fear, suggesting investors are overly panicked and assets may be undervalued. Historically, these periods have presented buying opportunities for contrarian investors, though markets can remain fearful for extended periods before recovering.
Extreme Greed and Correction Risks
Scores between 75 and 100 signal Extreme Greed, indicating overbought conditions and heightened correction risk. Milk Road analysis suggests these levels often precede significant pullbacks as profit-taking overwhelms buying pressure.
Navigating Neutral Territory
Readings between 25-49 (Fear) and 50-74 (Greed) represent transitional zones. Fear indicates cautious sentiment with possible entry points, while Greed suggests optimism without necessarily indicating overheated conditions.
How Has the Fear and Greed Index Evolved?
- 2012: CNN Business launches the original Fear and Greed Index for S&P 500 stocks, utilizing seven market factors including junk bond demand and safe haven flows. Source: CNN Markets
- 2018: Alternative.me adapts the methodology for Bitcoin and cryptocurrency markets, introducing crypto-specific metrics including Bitcoin dominance and social media sentiment analysis. Source: Alternative.me
- 2020: Major cryptocurrency data platforms including CoinGecko and CoinMarketCap launch proprietary versions, expanding coverage to Ethereum and altcoin markets. Source: CoinGecko
- 2021: The index registers sustained readings above 75 (Extreme Greed) during Bitcoin’s bull run above $60,000, coinciding with peak retail interest. Source: Bitbo Charts
- 2022: Market crashes including the Terra/Luna collapse and FTX bankruptcy drive the index below 20 (Extreme Fear) for extended periods, marking historic capitulation levels. Source: Bitbo Historical Data
- 2023-Present: Specialized providers like CFGI.io expand indices to cover over 50 individual tokens beyond Bitcoin, while maintaining the original 0-100 scale methodology. Source: CFGI.io
What Should Investors Know About Data Reliability?
| Established Facts | Uncertainties and Limitations |
|---|---|
| The index aggregates multiple weighted factors into a single 0-100 score using transparent methodologies | Exact proprietary algorithms and real-time weightings vary between providers and remain partially undisclosed |
| Extreme fear readings (0-24) historically correlate with market bottoms and capitulation events | Predictive accuracy for timing specific price reversals remains statistically unverified |
| The metric functions as a lagging sentiment mirror rather than a leading indicator | Social media sentiment analysis may misinterpret irony, sarcasm, or coordinated bot activity |
| Daily updates reflect rolling comparisons to 30-day and 90-day historical averages | Short-term volatility spikes can generate false signals during sideways or ranging markets |
| Bitcoin dominance and realized volatility provide measurable, objective data points | Long-term forecasting capability has not been validated against random walk alternatives |
How Do Stock and Crypto Fear and Greed Indices Compare?
While both tools measure market sentiment, the underlying components differ significantly between asset classes. CNN’s original stock index analyzes seven factors including junk bond demand, stock price strength, and safe haven flows. These metrics capture institutional behavior and macroeconomic conditions specific to equity markets.
Cryptocurrency versions substitute Bitcoin dominance for market breadth, replace bond spreads with stablecoin supply ratios, and incorporate 24/7 social media sentiment. Caleb and Brown notes that crypto-specific adaptations create higher volatility in readings due to the speculative nature of digital assets and constant trading availability.
No direct CNN cryptocurrency index exists; the crypto market relies entirely on adapted versions from Alternative.me, CoinMarketCap, and specialized data providers. These adaptations aim to spot emotional extremes in a market that trades continuously without traditional market hours or circuit breakers.
What Do Market Analysts Say About Sentiment Tracking?
“Be greedy when others are fearful,” captures the contrarian philosophy behind the index’s utility for identifying emotional extremes in market participants.
— Alternative.me Methodology
The index correlates with market turns but is not predictive; it serves as a lagging sentiment mirror rather than a guaranteed timing signal.
— Milk Road Analysis
Rising volatility compared to recent averages signals fear, while high positive volume indicates greed, providing a quantitative framework for emotional market analysis.
— Caleb and Brown Research
What Are the Key Takeaways for Crypto Traders?
The Fear and Greed Index offers cryptocurrency investors a quantitative measure of market psychology, helping identify emotional extremes that often precede trend reversals. While readings below 25 and above 75 provide useful context for potential entry and exit points, successful application requires combining these sentiment signals with technical analysis and fundamental research rather than relying on the metric in isolation. For ongoing market monitoring and additional analysis frameworks, consult the Fear and Greed Index – Crypto Market Sentiment Guide.
Frequently Asked Questions
How often does the Fear and Greed Index update?
Most providers refresh the index daily, though underlying components like volatility and volume update in real-time throughout trading hours. Alternative.me updates once per day based on aggregated 24-hour data.
Can the Fear and Greed Index predict Bitcoin price crashes?
No. The index correlates with historical price action but cannot predict future movements. It reflects current sentiment conditions rather than forecasting specific price events.
What constitutes a “good” Fear and Greed Index score?
Context determines utility: value investors often prefer extreme fear (0-24) for entry opportunities, while momentum traders may favor greed (50-74) for continuation patterns. Neutral readings suggest balanced sentiment.
Is there a Fear and Greed Index for Ethereum?
Yes, providers like CFGI.io offer sentiment indices for Ethereum and over 50 other altcoins, though Bitcoin remains the primary benchmark for broader market sentiment.
Why do different platforms show different scores?
Providers use varying algorithms, weightings, and data sources. CoinMarketCap incorporates derivatives data, while Alternative.me emphasizes broader sentiment metrics, resulting in slight score divergences.
How does extreme fear differ from regular fear on the index?
Extreme fear (0-24) indicates widespread panic and potential capitulation, whereas fear (25-49) represents cautious uncertainty without systemic market distress or mass selling.
Does the CNN Fear and Greed Index cover cryptocurrency?
No. CNN’s index exclusively tracks traditional stock markets. Crypto-specific versions are maintained by Alternative.me, CoinMarketCap, and specialized blockchain data platforms.

Amelia Grant is Local Government Editor at RegionalReport.co.uk, covering council decisions, regional public policy, combined authorities, planning, housing and transport.